Project Analytics
The Project Analytics module enables reservoir engineers to analyze large numbers of models, such as those generated by ensemble techniques.
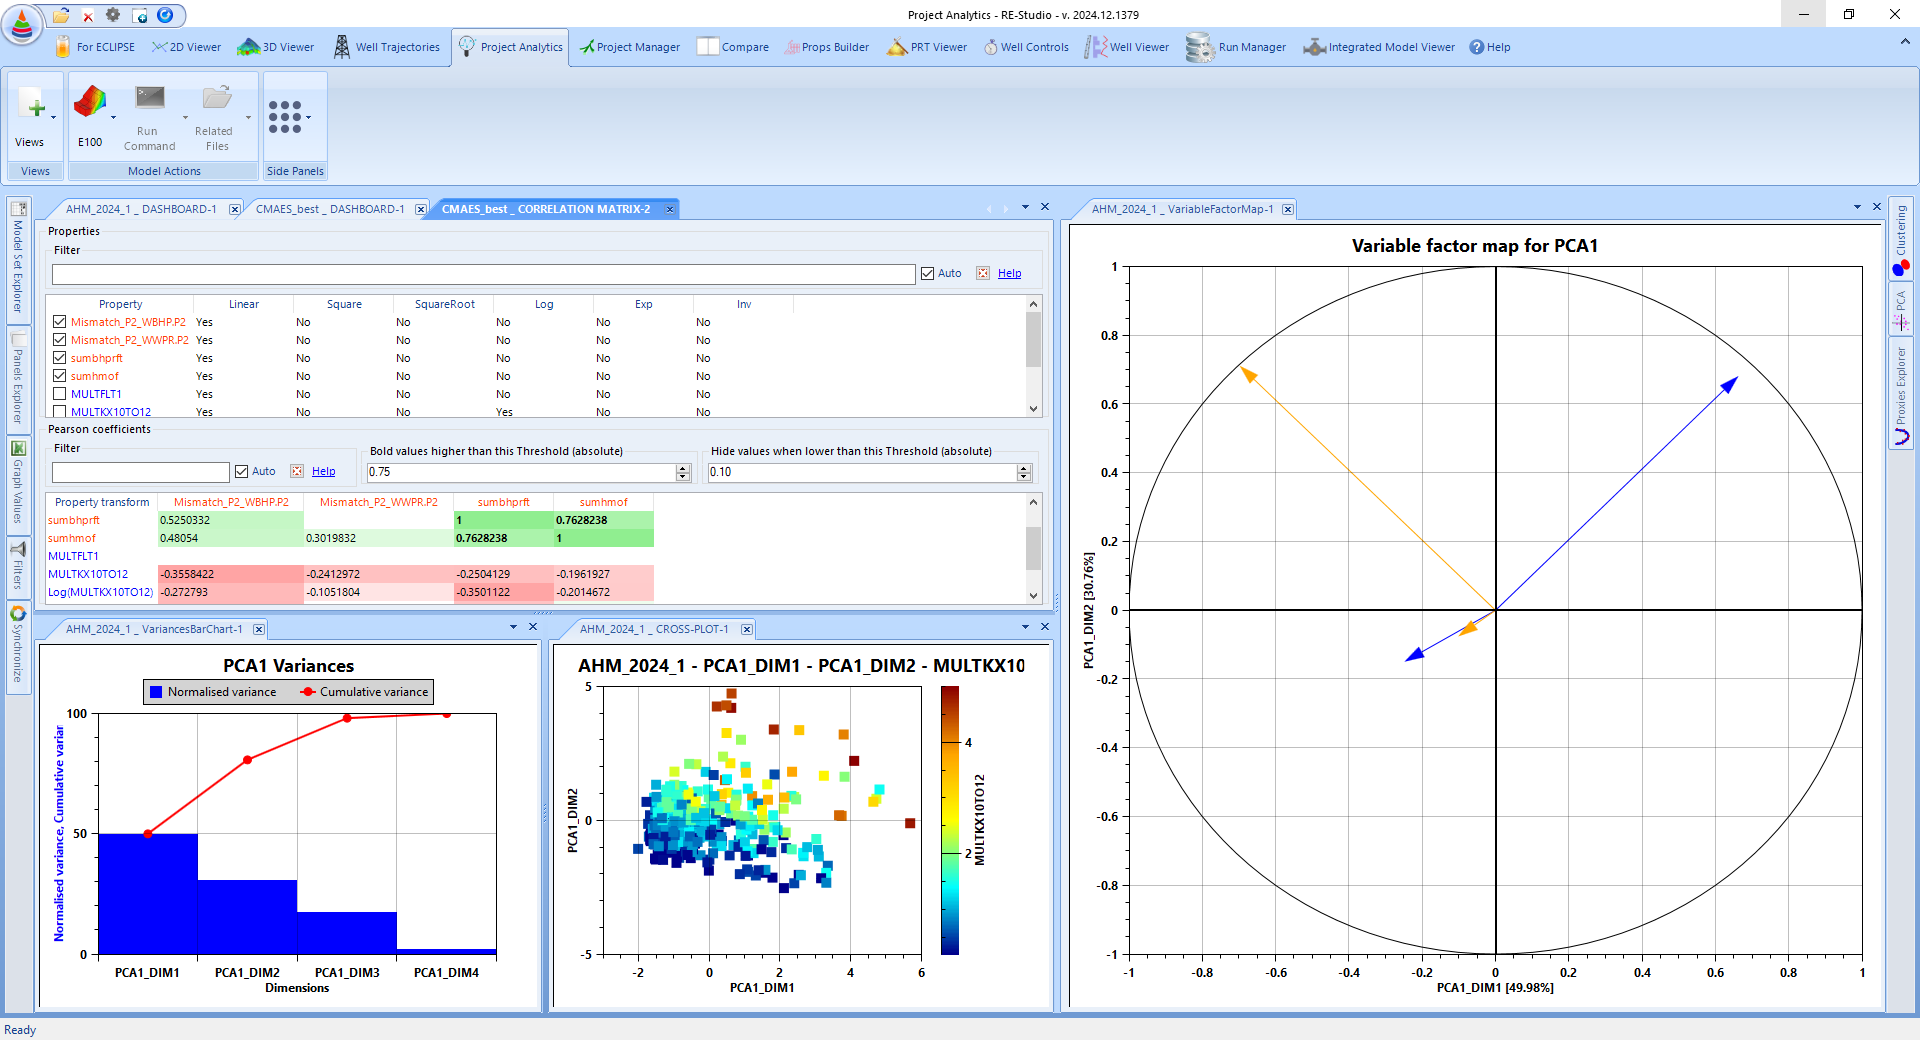
Indicators of interest are first defined. They can be, for instance, model input parameters, output results or calculated functions. This ensemble of indicators can be plotted (histograms, cross plots, etc.) and filtered on.
Statistics are easily generated. You just need to start by interactively defining the quantities of interest on one model, and then ask RE-Studio to extend the calculations for the rest of the models. You will then be able to visualize the final distributions for the quantities you defined and see where each model sits.
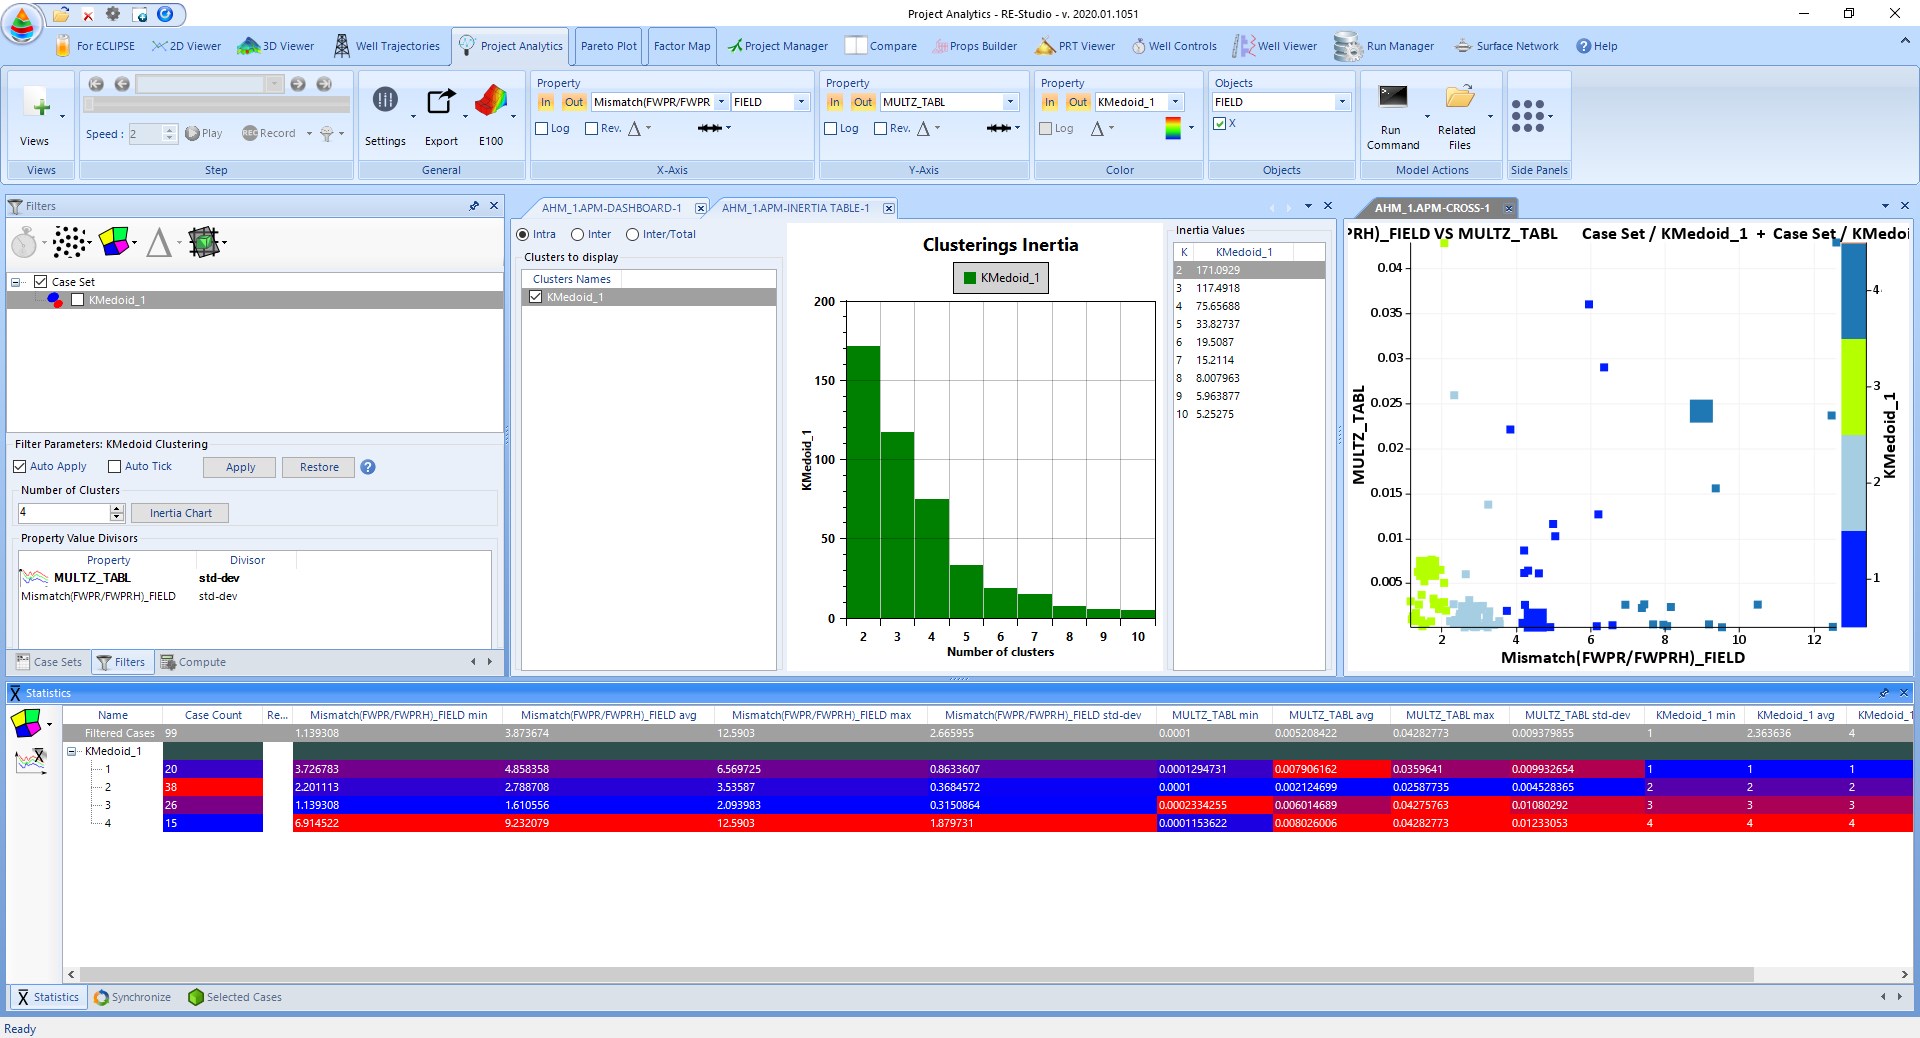
Clustering will provide representative models for the group of models. The clustering algorithm groups the models based on their similarity in terms of a user defined set of indicators. The number of clusters can be modified as deemed necessary, and, for each cluster, a representative of model is identified.


